Analog Run: Southeast GFS 20261102/1200F156
Top Analogs
Analysis Guidance
Hazard Guidance
Thumbnails
- Mean Height Analysis
- PMSL | 850 mb | 700 mb | 500 mb | 300 mb
- Mean Isotach Analysis
- 850 mb | 300 mb
- Mean Temperature Analysis
- 2 m | 850 mb | 700 mb
- Mean Moisture Analysis
- 2 m Dewpoint | Preciptable Water
- Standardized Anomaly - Height
- PMSL | 850 mb | 500 mb | 300 mb
- Standardized Anomaly - U Wind
- 850 mb | 300 mb
- Standardized Anomaly - V Wind
- 850 mb | 300 mb
- Standardized Anomaly - Temperature
- 850 mb | 700 mb
- Standardized Anomaly - Moisture
- Precipitable Water
- CAPE/Shear Analysis
- Surface-Based CAPE | 0-6km Shear
- Severe Parameter Analysis
-
Craven-Brooks
| Supercell Composite
Significant Tornado | Derecho Composite - CWASP Analysis
- CWASP > 60 | CWASP > 65 | CWASP > 70 | CWASP > 75 | CWASP > 80
- Member Analysis - Height
- PMSL | 850 mb | 500 mb | 300 mb
- Member Analysis - Temperature
- 2 m | 850 mb
- Member Analysis - Moisture
- 2 m Dewpoint | Precipitable Water
- NCDC COOP Snowfall
-
Mean
| Median
10th Percentile | 25th Percentile | 75th Percentile | 90th Percentile
> 2 in. | > 4 in. | > 6 in. | > 8 in. | > 12 in. | > 18 in. | > 24 in. - 1 Severe Report - Percentages
- Any Severe | Hail | Wind Report | Tornado
- 5 Severe Reports - Percentages
- Any Severe | Hail | Wind Report | Tornado
- 10 Severe Reports - Percentages
- Any Severe | Hail | Wind Report
- 1 Significant Severe - Percentages
- 1 Sig. Hail | 1 Sig. Wind | 1 Sig. Tornado | 1 Long-Track Tornado
- 5 Significant Severe - Percentages
- 5 Sig. Hail | 5 Sig. Tornadoes | 5 Long-Track Tornadoes
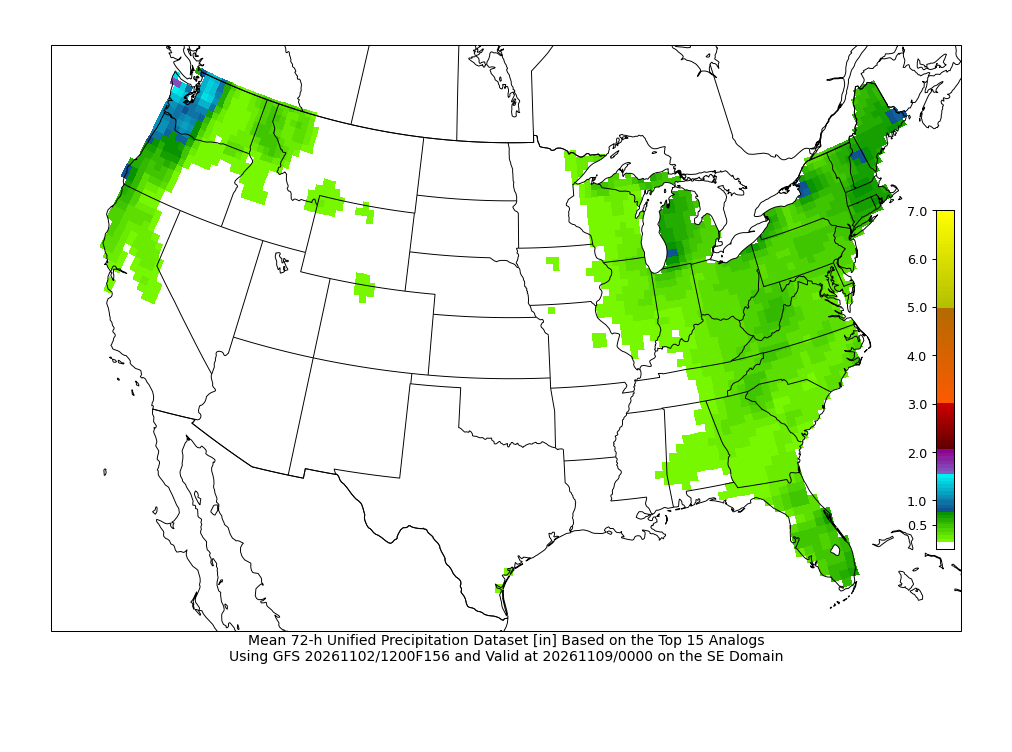
- 72-h Unified Precipitation
-
Mean
| Median
10th Percentile | 25th Percentile | 75th Percentile | 90th Percentile
> 0.5 in | > 1.0 in | > 2.0 in | > 3.0 in | > 4.0 in | > 5.0 in - Maximum Surface Temperature
- > 32° F | > 40° F | > 50° F | > 60° F | > 65° F | > 70° F | > 75° F | > 80° F
- Minimum Surface Temperature
- < 32° F | < 20° F | < 15° F | < 0° F | < -10° F | < -20° F | < -30° F
- Minimum Wind Chill
- < 0° F | < -10° F | < -20° F | < -30° F | < -40° F | < -50° F
- Maximum Surface Dewpoint
- > 55° F | > 60° F | > 65° F | > 70° F | > 75° F
- Maximum Surface Wind Gust
- > 30 kts | > 35 kts | > 40 kts | > 45 kts | > 50 kts | > 55 kts | > 60 kts
- Freezing Rain
- > 1 h | > 3 h | > 6 h
- Near Blizzard Conditions
- > 1 h | > 2 h | > 3 h
- Aviation - Flight Rules
- MVFR | IFR | LIFR
- Aviation - Visibility
- < 5 SM | < 3 SM | < 1 SM
- Aviation - Ceiling
- < 3000 ft | < 1000 ft | < 500 ft
| Readout: |